はじめに
prometheus-exporter に付属の設定ファイル(contrib/prometheus-exporter/conf/solr-exporter-config.xml)には様々なメトリクスの設定例が記載されており、これとGrafanaを組み合わせれば、かなり便利なダッシュボードが作れます。
この記事では、デフォルトの設定に無いメトリクスを自分で追加する場合の設定方法を試してみました。
solr-exporter-config.xmlの内容
SolrのどのAPIを使うかに応じて4つのセクションが用意されています。
<ping> PingRequestHandler へのリクエストを利用します <metrics> Metrics APIを利用します <collections> Collections APIを利用します <search> 検索リクエストを利用します たとえば <ping> セクションは以下のように定義されています。
    <ping>
      <lst name="request">
        <lst name="query">
          <str name="path">/admin/ping/</str>
        </lst>
        <arr name="jsonQueries">
          <str>
            . as $object | $object |
            (if $object.status == "OK" then 1.0 else 0.0 end) as $value |
            {
              name         : "solr_ping",
              type         : "GAUGE",
              help         : "See following URL: https://lucene.apache.org/solr/guide/ping.html",
              label_names  : [],
              label_values : [],
              value        : $value
            }
          </str>
        </arr>
      </lst>
    </ping>
name=”path” でリクエスト先のパスを指定しています。
ping リクエストの応答をどのように加工するのかを指定しているのが、name=”jsonQueries” の下の str タグに囲まれた領域です。jq クエリが使われているので jq コマンドで動作確認できます。
$ curl --user solr:SolrRocks -s 'http://localhost:8983/solr/test_shard1_replica_n1/admin/ping/' |jq '            . as $object | $object |
>             (if $object.status == "OK" then 1.0 else 0.0 end) as $value |
>             {
>               name         : "solr_ping",
>               type         : "GAUGE",
>               help         : "See following URL: https://lucene.apache.org/solr/guide/ping.html",
>               label_names  : [],
>               label_values : [],
>               value        : $value
>             }
> '
{
  "name": "solr_ping",
  "type": "GAUGE",
  "help": "See following URL: https://lucene.apache.org/solr/guide/ping.html",
  "label_names": [],
  "label_values": [],
  "value": 1
}
searchメトリクスを追加してみる
単純な例ですが、全件検索(‘*:*’による検索)のヒット件数をグラフにしてみます。
solr-exporter-config2.xml に以下を追加します。
    <search>
      <lst name="request">
        <lst name="query">
          <str name="collection">wikipedia</str>
          <str name="path">/select</str>
          <lst name="params">
            <str name="q">*:*</str>
            <str name="start">0</str>
            <str name="rows">0</str>
          </lst>
        </lst>
        <arr name="jsonQueries">
          <str>
            .response.numFound as $value |
            {
              name         : "solr_num_wikipedia_entry",
              type         : "GAUGE",
              help         : "number of wikipedia entry",
              label_names  : [],
              label_values : [],
              value        : $value
            }
          </str>
        </arr>
      </lst>
    </search>
ここで指定した内容は、実際には以下のような検索リクエストになります。
$ curl --user solr:SolrRocks -s 'http://localhost:8983/solr/wikipedia/select?q=*:*&start=0&rows=0'
{
  "responseHeader":{
    "zkConnected":true,
    "status":0,
    "QTime":0,
    "params":{
      "q":"*:*",
      "start":"0",
      "rows":"0"}},
  "response":{"numFound":2264810,"start":0,"numFoundExact":true,"docs":[]
  }}
jq クエリによる加工結果は以下の通りです。
$ curl --user solr:SolrRocks -s 'http://localhost:8983/solr/wikipedia/select?q=*:*&start=0&rows=0' |jq '.response.numFound as $value |
>             {
>               name         : "solr_num_wikipedia_entry",
>               type         : "GAUGE",
>               help         : "number of wikipedia entry",
>               label_names  : [],
>               label_values : [],
>               value        : $value
>             }
> '
{
  "name": "solr_num_wikipedia_entry",
  "type": "GAUGE",
  "help": "number of wikipedia entry",
  "label_names": [],
  "label_values": [],
  "value": 2264810
}
prometheus-exporter によって以下のような Prometheus フォーマットに変換されます。
$ curl -s http://localhost:9854/|grep solr_num_wikipedia_entry
# HELP solr_num_wikipedia_entry number of wikipedia entry
# TYPE solr_num_wikipedia_entry gauge
solr_num_wikipedia_entry{zk_host="localhost:9983",} 2264810.0
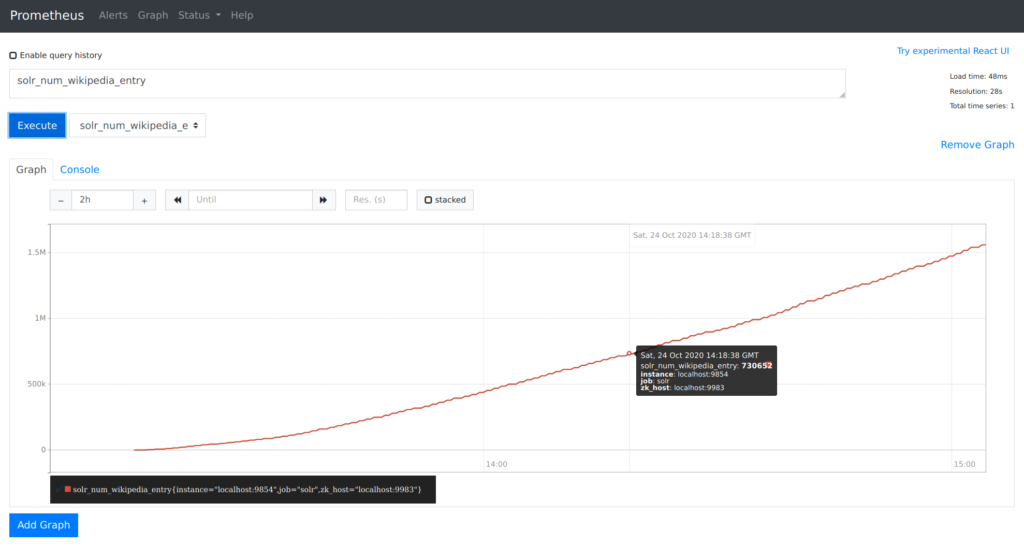
ここまで来れば、グラフ化するのは簡単です。下の画像は、データインポートハンドラでWikipediaの日本語全記事を投入したときの、記事数の変化をグラフ化したものです。